Editorial Note: We earn a commission from partner links on Doughroller. Commissions do not affect our authors’ or editors’ opinions or evaluations. Learn more here.
There are a lot of tools out there to track your investments. One of my favorites is Empower. It offers a free online financial dashboard that automatically tracks your investments and your spending. Today I have another option for you–a free spreadsheet that tracks your investments and tells you when it’s time to rebalance your portfolio.
I have to give a BIG thank you to a reader named Dan. He built this spreadsheet and shared it with me weeks ago. With his permission, I’ve created a copy and am sharing it with you today. Thanks, Dan!
The Spreadsheet
To start, you can see the spreadsheet by clicking here. It is built in Google Sheets. When you go to the spreadsheet, you’ll see a sample portfolio built with Vanguard mutual funds and ETFs. This is not my portfolio (or Dan’s). But it will give you a clear picture of how it works.
You’ll want to make a copy of it so that you can edit it and save your own portfolio. Remember, in order to make a copy, you’ll need a Google account and you’ll need to be signed in. Once that’s taken care of, you can make a copy by selecting ‘File’ from the menu and then ‘Make A Copy.’
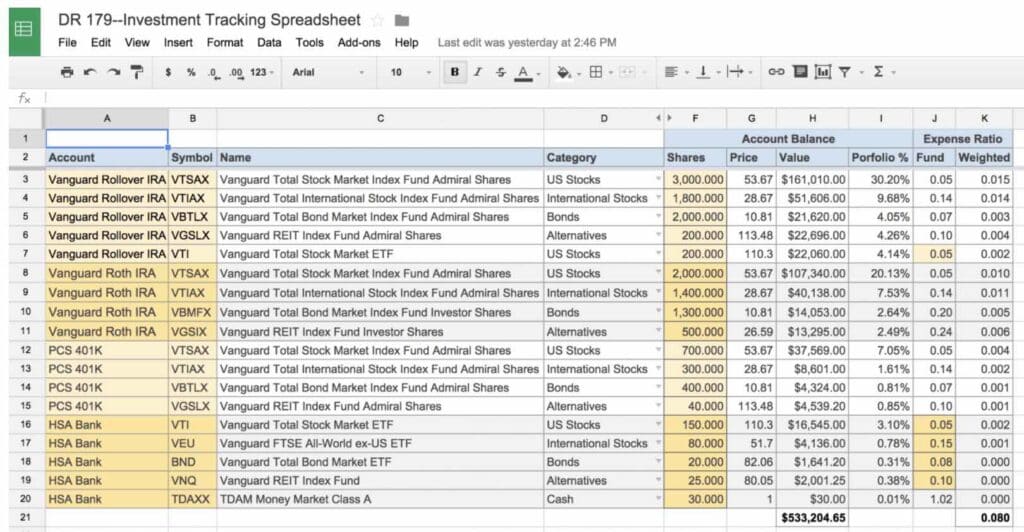
The workbook has just two sheets. The first sheet lists all of your holdings (click image to enlarge):

The sections in color you’ll need to fill out. Once you do, the other columns get automatically populated using the Google Finance function and built-in formulas. Note that for ETFs you’ll need to input the expense ratio yourself. For reasons unknown, the Google Finance function doesn’t provide it.
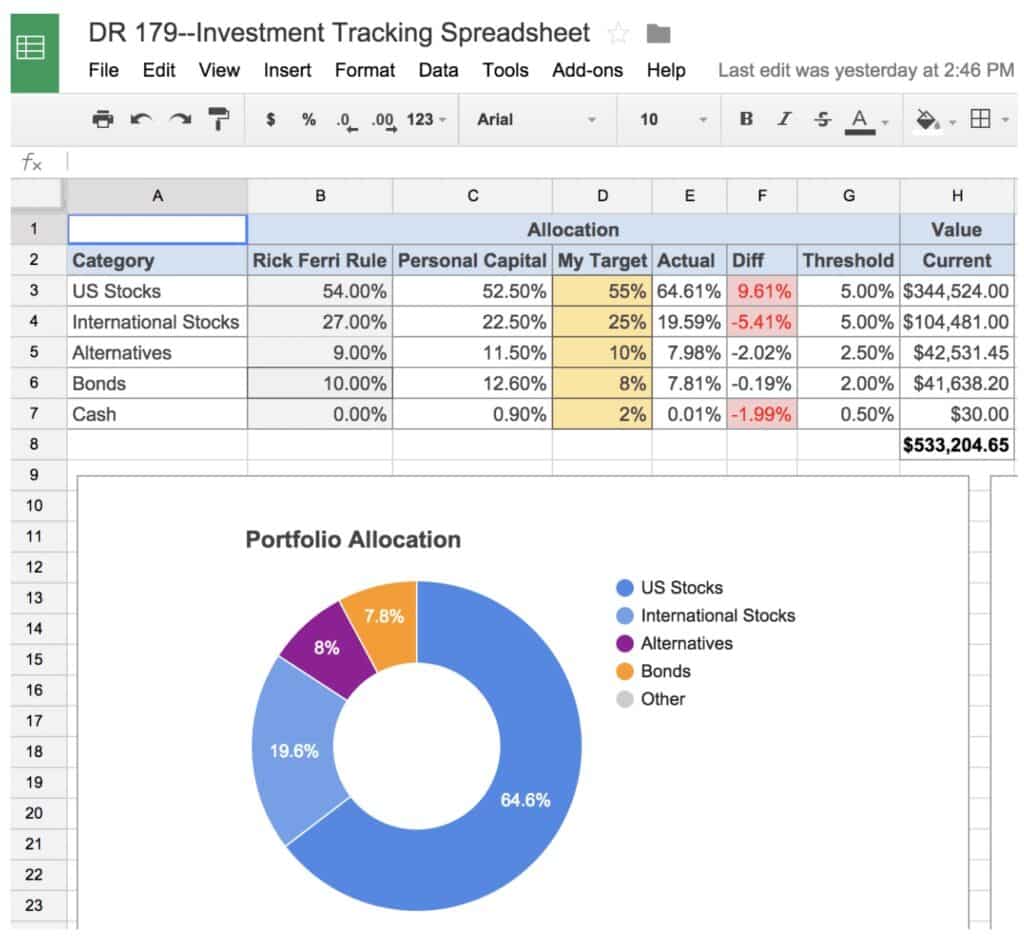
The second page provides a summary of your investments by asset class, tells you when it’s time to rebalance, and provides a graph of your investments:

The Rick Ferri and Empower allocations are there just for ideas. You’ll enter your asset allocation in the column labeled “My Target.” Note that the spreadsheet comes with five asset classes listed in rows three through seven. The spreadsheet calculates how much you have in each asset class based on column D of the first page of the workbook. If you want to add or change asset classes, you can. Just remember to add them in column D of page one and then add a row for each new class on this page.
I use both this spreadsheet AND Empower to track my investments. The spreadsheet helps me rebalance my investments, as you’ll see below. Empower is excellent for tracking investment fees, asset allocation, and even my monthly budget. It’s by far my favorite financial tool, and it’s totally free.
Rebalancing
One of the cool features of this spreadsheet is the rebalancing function. You’ll see in the sheet above columns labeled ‘Actual’, ‘Diff’, and ‘Threshold.’ It’s critical to understand how these work.
Actual: This simply calculates the actual amount of investments you have in each asset class. This data comes from the Holdings page of the spreadsheet.
Diff: This column calculates the difference between your target allocation by class and your actual allocation. Note that some of the cells in this column are in red.
Threshold: This column allows you to set a threshold for each asset class. In other words, how much can your actual investments drift from your target allocation before you need to rebalance? Once your actual allocation drifts from your target by the threshold percentage, the difference in the Diff column turns red. It’s a visual way to see what part of your portfolio might need to be rebalanced.
Leave comments below if you have any questions on how to use the spreadsheet.
Enjoy! Check It Out: Empower Review
Learn More: The Best Stock Tracking App
(Personal Capital is now Empower)


